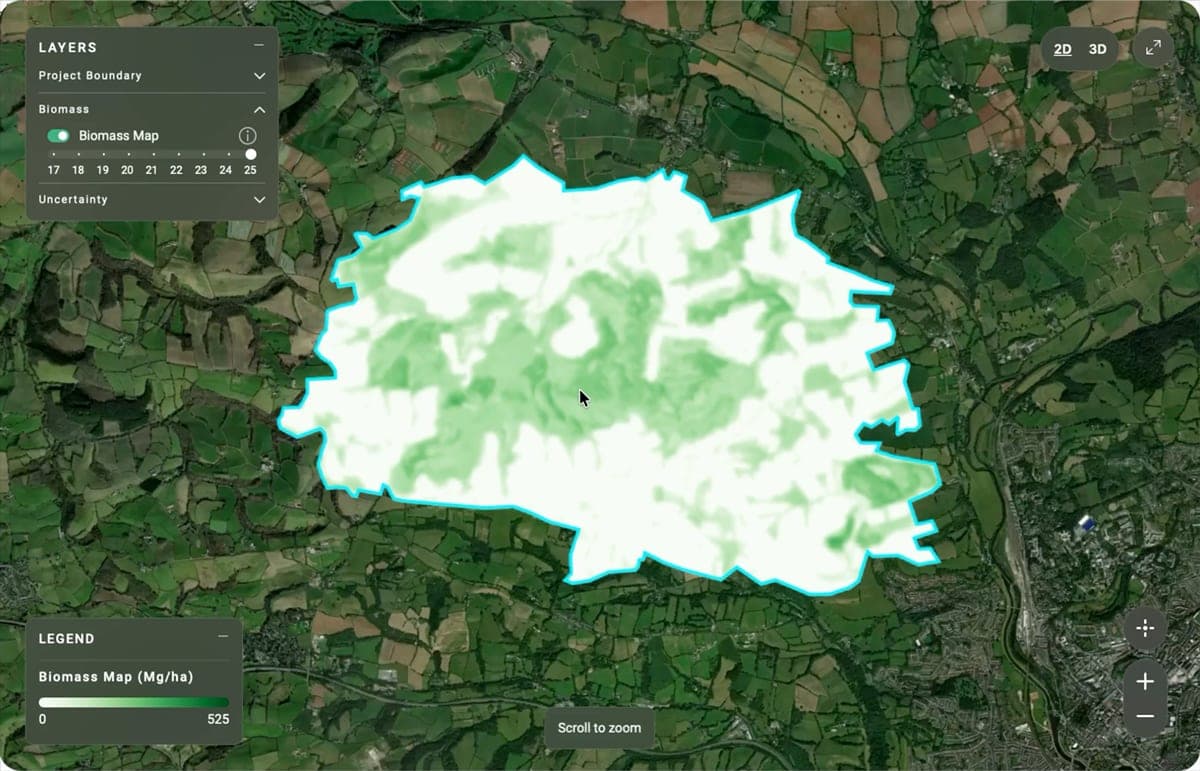
A model of your forest that gets sharper with every measurement.
Built from satellite imagery and your own fieldwork, and updated each time new data comes in. Biomass on every hectare, so you can track growth, spot loss early and manage risk.
Trusted by




R&D funding from



What our biomass model tells you.
What is there.
Biomass density for every hectare at 10 m resolution, each with its own uncertainty figure, so you can see where the volume sits and how much it varies across the site.
- Year 1Year 5Year 9
What changed.
Nine years of biomass change, so you see growth, loss and disturbance over time rather than one snapshot. Add new data and the history is rebuilt with it.
Where to act.
The model knows where it is least confident, so field campaigns go where they are worth the most. Spend less on fieldwork and get a better model each time.
Our differentiator
Your data, integrated into the model itself.
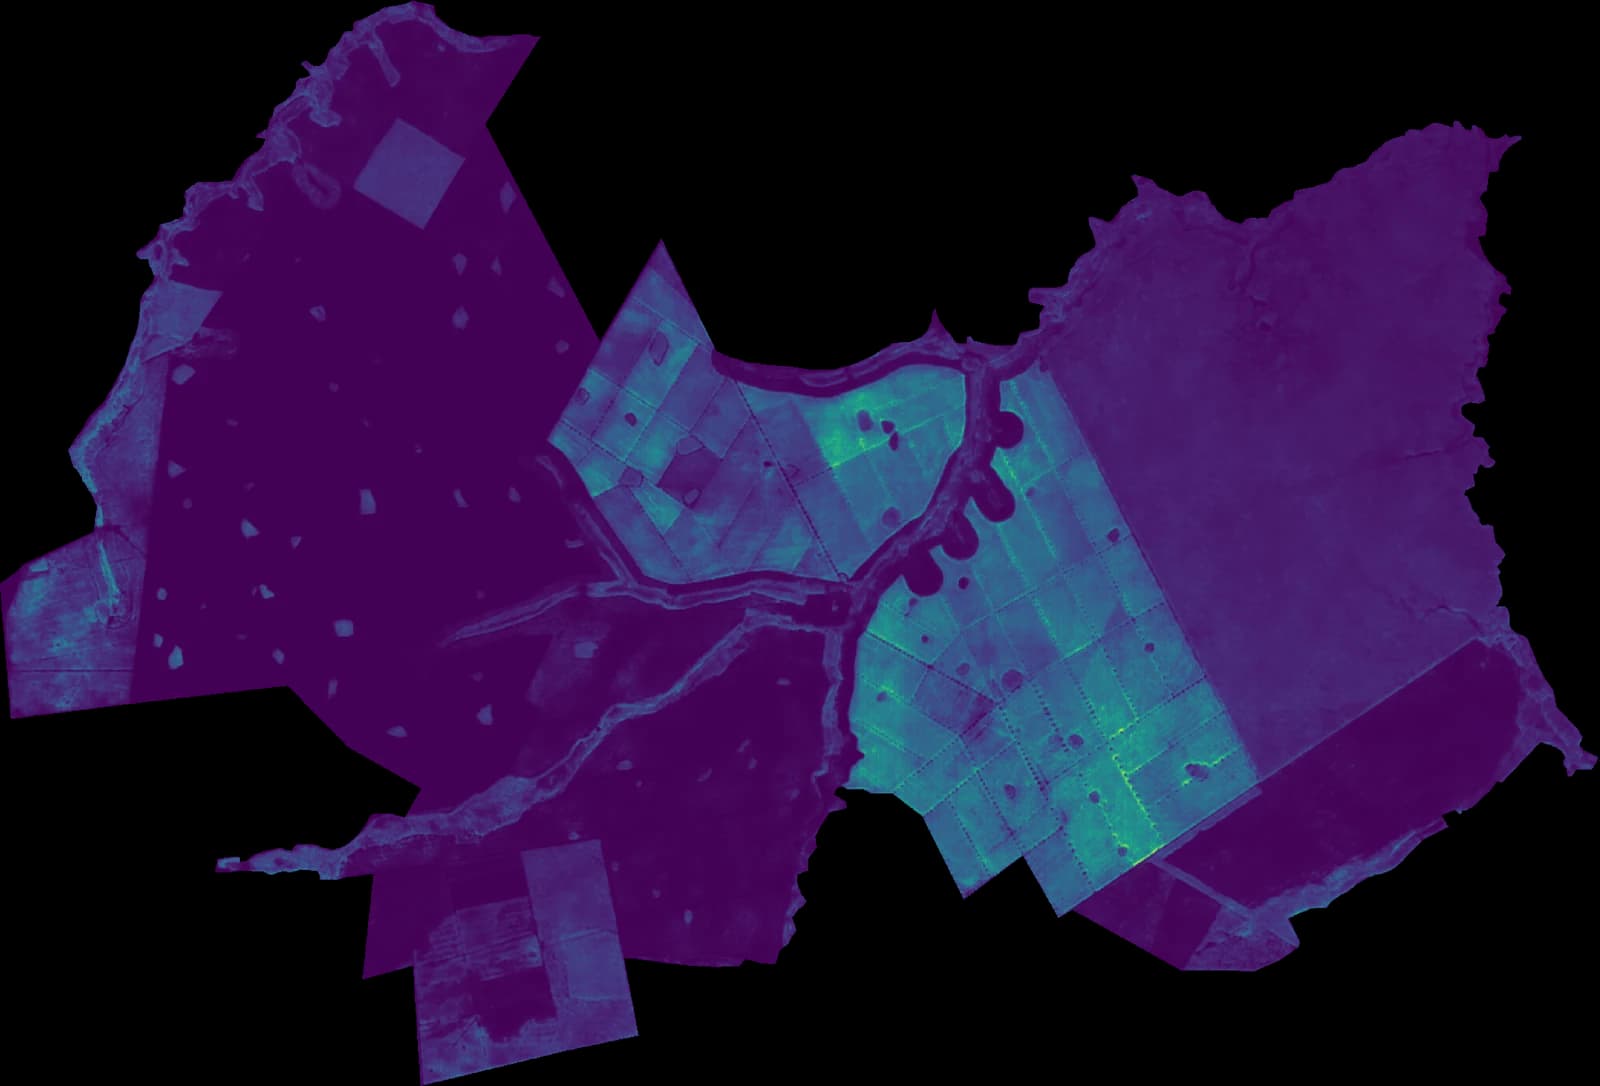
There are two ways to use field data. Calibration corrects a finished model after it has run, which only helps where the plots are. Step outside them and you are back on a global average. Integration puts your plots inside the model and rebuilds it.
We do the second. Your field and drone data move the estimate, the pattern across the whole site and the confidence, all at once.
Calibration is a patch on the output. Integration is your data in the engine.
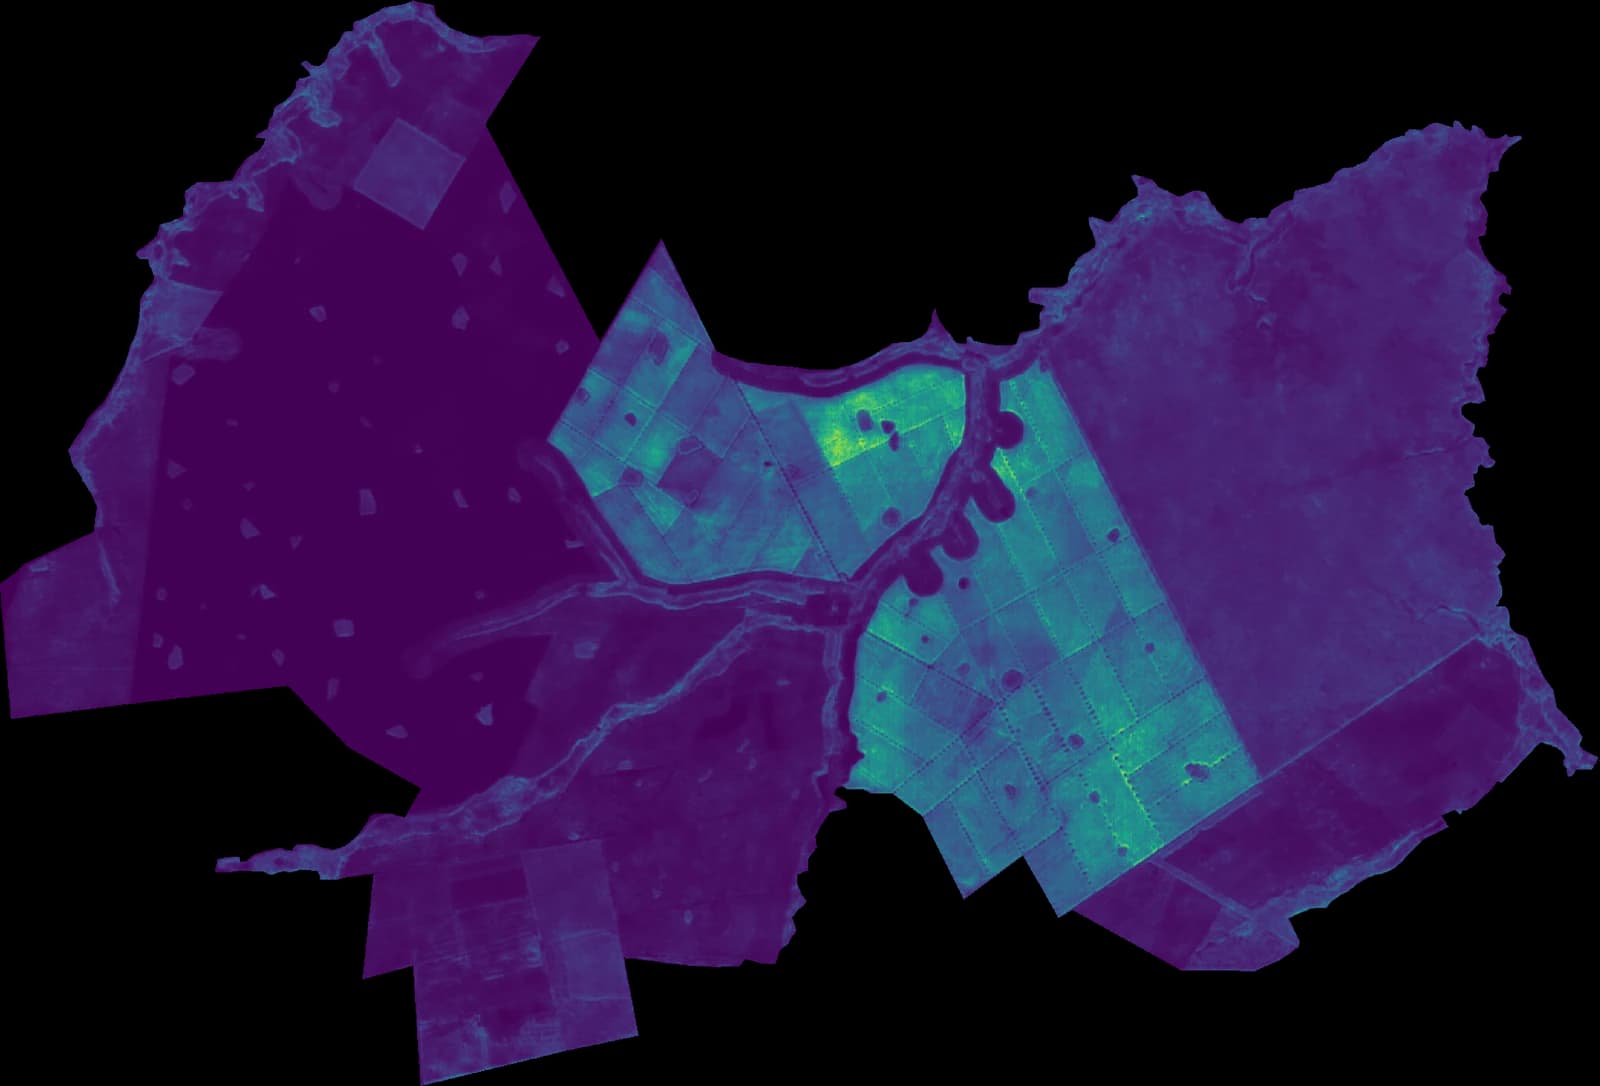
It improves backwards as well as forwards.
Every time data is added the model updates, including the historic time series, so past estimates get better too.
Continuous learning.
The longer the model runs and the more data you add, the better it performs.
The Treeconomy Biomass Engine.
Satellite.
Runs anywhere from a site boundary alone. No field data needed.
Integrated.
Your field data goes into the model, so the whole site sharpens and the confidence tightens.
- Resolution
- 10 m
- Resolution on both tiers
- Record
- Versioned
- And auditable
- Uncertainty
- Per pixel
- Uncertainty quantified
Solutions
Different goals, same engine.
Valuation · Reporting · Risk
Asset managers
Valuation, reporting, risk management and where to spend next. Put your inventory in the model and every holding gets a current number you can stand behind.
Screening · Evidence · Monitoring
Project developers
Build the model once, run the assessments a verifier needs, and improve it over time. Every campaign you add makes the next assessment stronger.
Already running on real portfolios and projects.
Asset manager
Gresham House
Uses it for
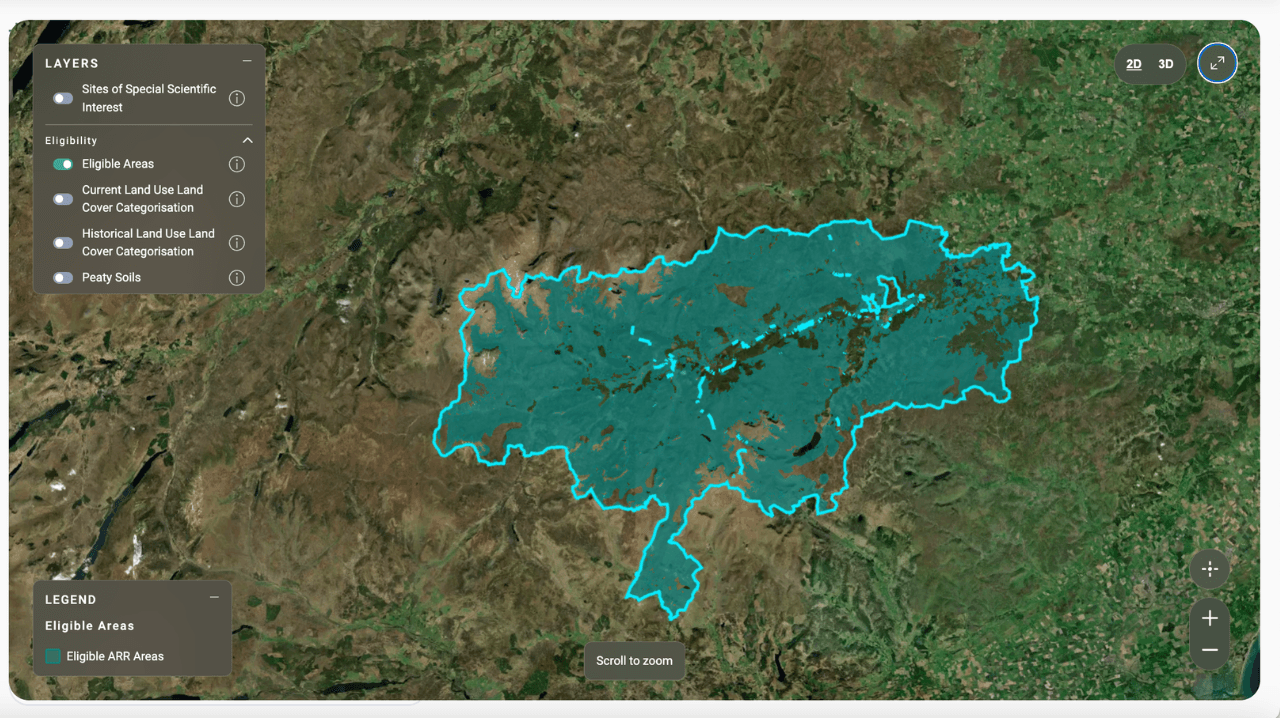
Biomass analysis across part of a managed forestry portfolio, digitising institutional inventories.

Asset manager
Great Yellow
Uses it for
The biomass analysis across a nature recovery portfolio.

Project developer
Africa Carbon Partners
Uses it for
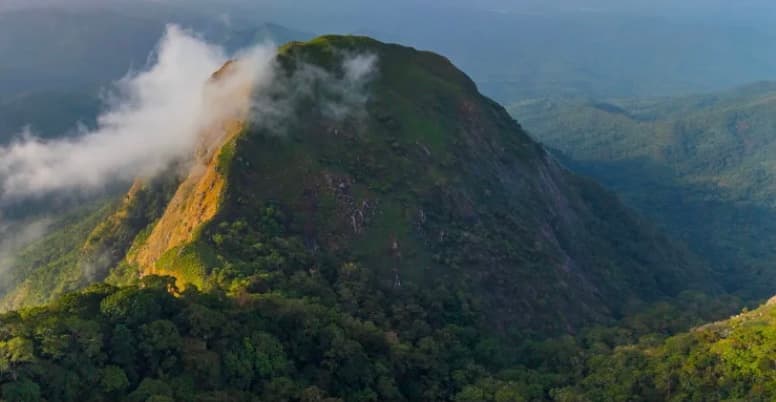
An ARR project across roughly 350,000 hectares in Gashaka Gumti National Park, Nigeria.
Forest decisions deserve more than a snapshot.
Whether you are valuing a portfolio, preparing for verification or deciding where to invest next, we build the model underneath it and keep it up to date.