Ackron Case Study #3 - Tree Counting
Learn more about how our Treeconomy technology allows us to quickly and accurately count the number of trees in a woodland.
Case Study
Project Development
Science & Tech
Apr 21, 2021
Emily Houston

Counting trees doesn’t sound like it should be too much of an undertaking; it’s just counting, how hard can it be? Perhaps you are picturing a small clump of trees that you could easily walk around and count, or your garden, or your local park. Now imagine a large and remote woodland, with trees covering hectare after hectare. Suddenly the task is less manageable, less feasible, and certainly less appealing.
Thankfully, remote sensing and AI technology offer an easier way. With drones and software, we can count trees rapidly, accurately, and comprehensively.
Throughout this series of blogs, we have been discussing Ackron Mixed Woodland, a forest carbon project in northern Scotland, near Melvich. In 2000, 40.1 hectares (ha) of sweeping moorland used for animal grazing was planted with a broadleaf and conifer mix in one of the earliest registered carbon projects in the Woodland Carbon Code (WCC). At the time of its second official verification (a manual carbon stock audit), our work revealed inaccuracies in the biomass and carbon estimates provided by the standard-approved Validating and Verifying Bodies (VVBs). We undertook post-survey work, which involved comparing carbon numbers to understand why differences arose.
There were two main areas from which errors stemmed, both of which highlighted the shortcomings of traditional sampling methods. The first was the measurement of the planted area. We improved on previous size estimates using segmentation to ‘clip’ the measurement boundaries and ensure only wooded sections were measured. This marked a significant improvement on the crude polygons used previously by the WCC and VVBs to measure the planted area. Our analysis revealed that the true planted area was roughly 15% smaller than had been identified manually. You can see this clearly from the images below and read more about segmentation in our blog.

On the left, you can see the original WCC polygons used to measure the size of the planting site. On the right, you can see the output from our analysis, where the boundaries of the planting site are neatly clipped to ensure only wooded land is measured.
The second area from which error arose was tree count. Errors in tree count, combined with errors in the estimation of site size, led verifiers to produce a significant overestimation of above-ground carbon stocks across Ackron Mixed. In this blog, we will explore how inaccuracies in tree count arose and how remote sensing and analysis provide a viable and valuable way to improve tree count accuracy in carbon projects.
How has tree counting been done to date?
Using traditional methods at Ackron, original sampling was done based on 21 circular sampling plots, each with a radius of 5.6 metres. This means each sample plot had an area of 98.52 m², and the total sampled area was 2,069 m². 2,069 m² represents just 0.6% of the entire project area: less than 1% of the project area was counted and used to infer the total number of trees across the project.
You can get a quick feel for whether 21 sample plots were enough by plotting a simple graph showing the moving average of total trees based on the density of trees observed from the sample plots. Our observations showed that the number of trees at Ackron counted using traditional methods is subject to significant fluctuations based on the number of sample plots. A considerable sampling constraint of conventional methods is that there may never be enough sample plots to establish a representative estimate. The number and location of sample plots will inevitably introduce error versus a complete “forest census”. Technology can provide a solution to this. By substituting in a tree count obtained through remote sensing and data analysis, we could accurately refine the Ackron tree count and, therefore, greatly improve the above-ground carbon stock calculations.

Moving average of trees at Ackron Mixed
How can we count trees better?
Our tree count analysis at Ackron was based on data from Structure from Motion (SfM) photogrammetry. Photogrammetry involves taking multiple aerial photographs of a site that overlap. At Ackron, we used thousands of photos captured from a drone in motion to reconstruct a 3D model of the site.
From photogrammetry, we obtained two outputs - a point cloud and a high-resolution orthophoto from which we can conduct further data analysis. To construct a point cloud, we match the corresponding features on the photographs to estimate the location and orientation. This allows us to extract a cloud of tie points that provides a 3D model of the terrain. This point cloud provides us with lots of information - a Digital Surface Model (DSM) and a Digital Terrain Model (DTM), which can be combined to provide us with a Canopy Height Model (CHM) from which it is possible to perform a tree count. The point cloud of Ackron is shown from different angles in the images below.

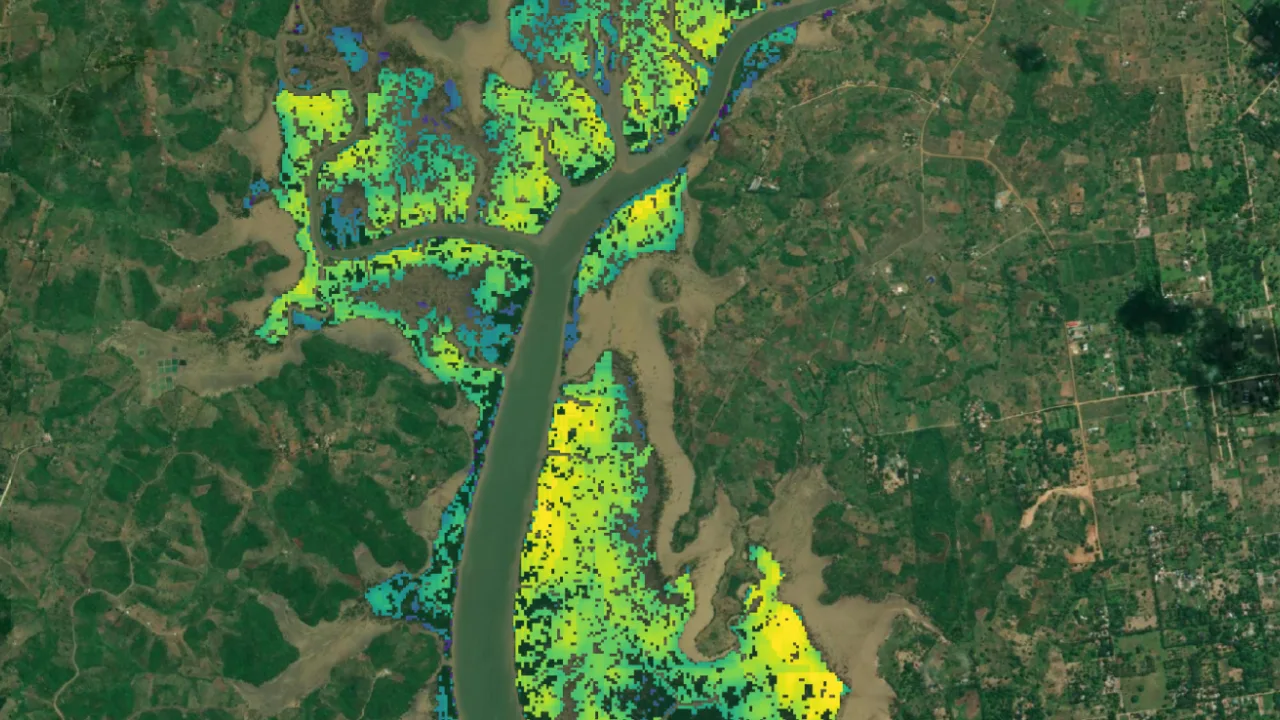
Drone-based photogrammetry also provides us with a high-resolution orthophoto – a geometrically corrected or “ortho-rectified” image. At Ackron, we used this orthophoto with a convolutional neural network that utilises deep learning object detection to allow us to count the number of trees and delineate the crowns of each tree in the woodland. Through this technique, we established a comprehensive tree count for the site: 37,240 trees, a 53% reduction from the original value. Using this tree count in the calculation of above-ground carbon stock yielded significant changes.
For example, using the count in estimates of lodgepole pine trees (not seedlings or saplings) reduced the estimated storage in lodgepole pine trees from 4,309 tonnes of CO₂ to 2,294 tonnes of CO₂. Without altering the seedling and sapling measurements, or the broad-leaved trees, this reduced the total CO₂ sequestered to 2,349 tonnes of CO₂. Images from our tree count can be seen below.

A bonus of using high-resolution remote sensing technology in tree counting is that it allows one to identify the proportion and location of broadleaf versus coniferous trees growing in a block of woodland, as well as an overview of height distribution and forest structure. Understanding this, we can advise landowners and VVBs on which areas of woodland they need to sample to capture a representative and optimum mix of broadleaves and conifers to avoid sampling issues like those experienced at Ackron. For example, at Ackron, traditional random sampling of trees captured just one broadleaved tree. However, we know from the Project Design Document that 23% of trees planted were broadleaved. Our remote sensing imagery analysis highlights that the broadleaved trees are concentrated in a part of the site that was missed during the 15-year sampling. Using technology to inform systematic or stratified sampling could help increase the accuracy of future sampling efforts.
Tree counting from remote sensing data re-emphasises the enormous and untapped potential of technology. As illustrated here, the crude nature of traditional sampling techniques makes them highly vulnerable to error, hugely costly, and time-consuming. Combined, these factors make them hard to scale at the rate demanded by the voluntary carbon market, which is seeing a proliferation of new planting projects emerge. Our post-survey work helps demonstrate how remote sensing technology, computer vision, and AI can improve the precision and ease of tree counting over a project site and thus improved the quantification of above-ground carbon stocks. With the recent release of the IPCC’s most recent AR6 report, carbon dioxide removal has been deemed ‘unavoidable’: the science is unequivocal in telling us that we must embrace carbon removal to avert climate breakdown. Ensuring the accuracy and validity of carbon projects worldwide has therefore never been more crucial. It’s vital that we be able to reliably measure and monitor nature-based climate impact.
In our next Ackron case study blog, we will be digging into how forest carbon calculations are traditionally performed and how technology can offer substantial improvements.
To keep up to date with further announcements at Treeconomy HQ and how the initiatives are doing, make sure you follow us on our social media channels.If you missed the previous blogs in the series you can catch up with them below.
Blog 1 - Measuring woodland carbon
Blog 2 - Segmentation