Seeing the trees for the forest: How Treeconomy uses computer vision for carbon monitoring
So what can AI do for nature-based carbon projects? Today we’ll be diving into our use of computer vision for accurate tree counting and carbon estimation.
Project Development
Science & Tech
Sep 14, 2023
Rob Godfrey
Sherwood 2.0 launches in just a few weeks.
In the run-up to the imminent unveiling of our fully upgraded monitoring platform for nature-based carbon projects, we wanted to share a bit more about the science and technology that underpins our best-in-class measurement, management, and reporting solution.
Computer vision forms part of the rapidly advancing field of machine learning and artificial intelligence. It is used to perform a variety of analyses on visual imagery such as segmentation or classification and forms a central element of our work to better monitor nature-based carbon projects.
Today we’ll be diving into our use of computer vision for accurate tree counting and carbon estimation.
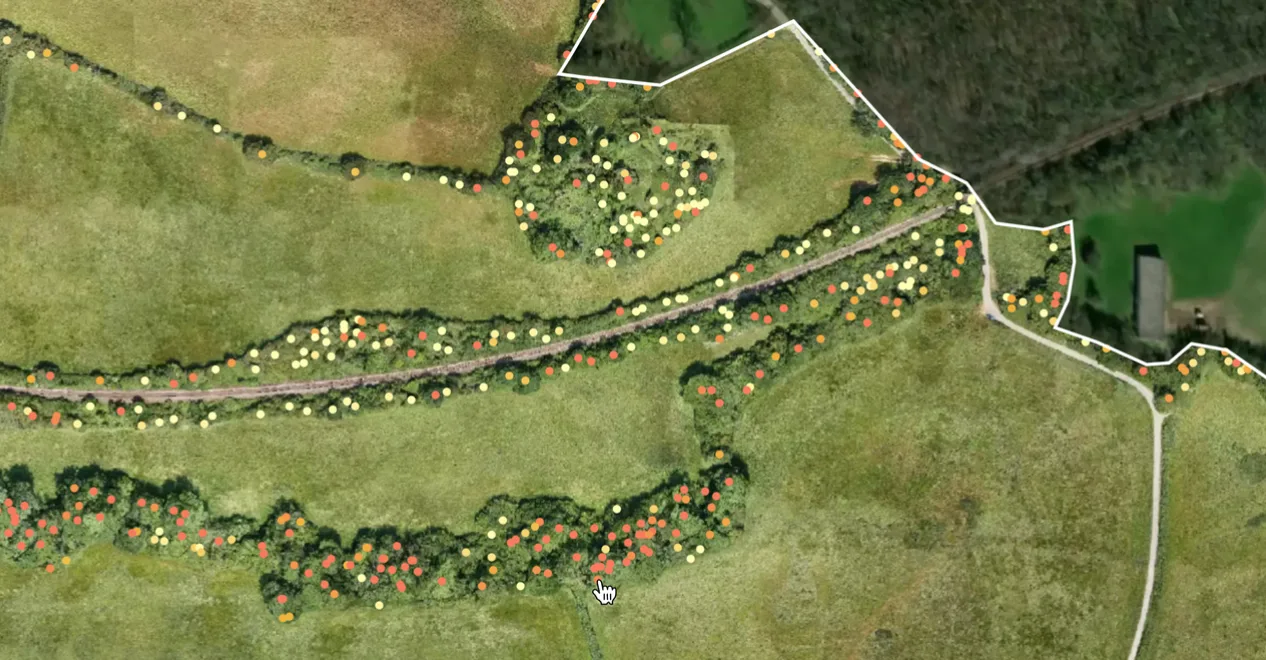
Computer vision techniques can be used to detect and even delineate individual trees from aerial imagery.
Why we use computer vision
We are developing tools for rigorous and reliable forest carbon accounting, bringing needed trust (and funding) to nature-based carbon removal.
Conventional methods for assessing forest carbon stocks involve the use of a human auditor sampling a small proportion of all the trees in the forest across a number of sample plots. Carbon stocks in tree biomass are estimated via the measurement of tree girth (diameter at breast height) with tape measures. These diameter measures are input into allometric equations to estimate the overall mass of each tree within the plot. These equations are generally sourced from the literature and timber industry, connecting girth to overall volume and mass.
On the basis of plot level estimates of carbon, total woody carbon stocks for the entire project area are estimated via extrapolation from sampled areas, usually constituting less than 5% of the total project area. Derived in this manner, carbon estimates are subject to considerable error and, with so few trees evaluated, can be skewed significantly as a result of small and unrepresentative sampling. Moreover, this highly manual process is both time consuming and costly, and therefore generally only completed every few years. For more information on business-as-usual methods and a detailed carbon measurement case study, have a look at our blog on Ackron Mixed, a forest project in Scotland.
By contrast, we aim to take a comprehensive view of each forest project, addressing errors in carbon stock estimation by counting all trees, achieving this through the use of remote sensing data and computer vision.
How we do it
We begin our assessment with the collection of remote sensing data. For tree counting, we collect this data from a variety of earth observation data sources, chiefly using very high resolution aerial imagery (<5cm) from drone flyovers. We also collect 3D point cloud data, providing a “digital twin” of the forest. This is performed through LiDAR aerial laser scans or photogrammetry, which involves stitching together millions of photographs.
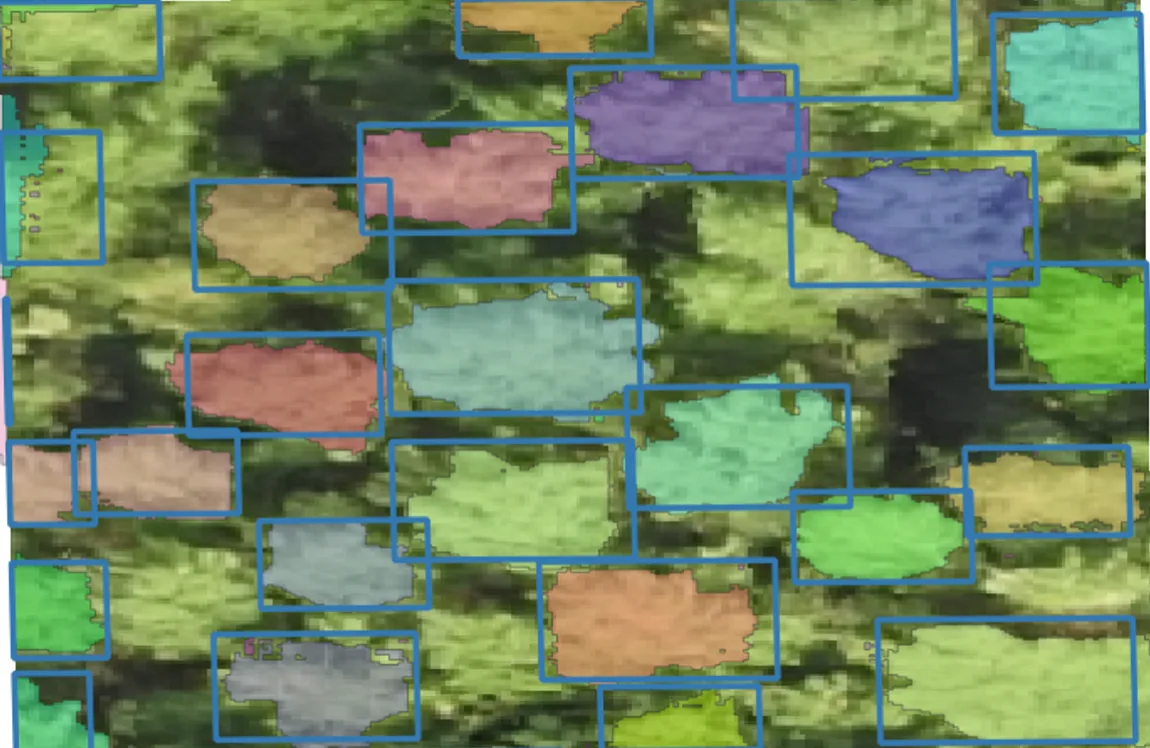
Our data is then fed into our data pipeline and presented to our computer vision algorithm. A form of deep learning tool known as a convolutional neural network (CNN), our algorithm has been trained with millions of images to detect and delineate tree canopies from aerial imagery.
Importantly, we manually validate a portion of the forest to evaluate the accuracy and precision of our models. Of course, every forest is different and an aerial view doesn’t tell the whole story. For that reason, we work closely with site managers to obtain so-called “ground truth” or reference data from the field, allowing us to confirm the accuracy of our assessments (for example by comparing AI-inferred forest density and that determined from an in-field sample). Equipped with earth observation and field data, we can further fine-tune our model parameters to produce optimal forest assessments.
Our cloud-based data processing pipeline then takes over to count trees, resulting in a map displaying individual tree canopy detections. Each tree is given a unique Tree ID number to which a host of metadata is connected, for further insights right down to the tree level, including per-tree carbon stocks (once calculated), height, species and more.
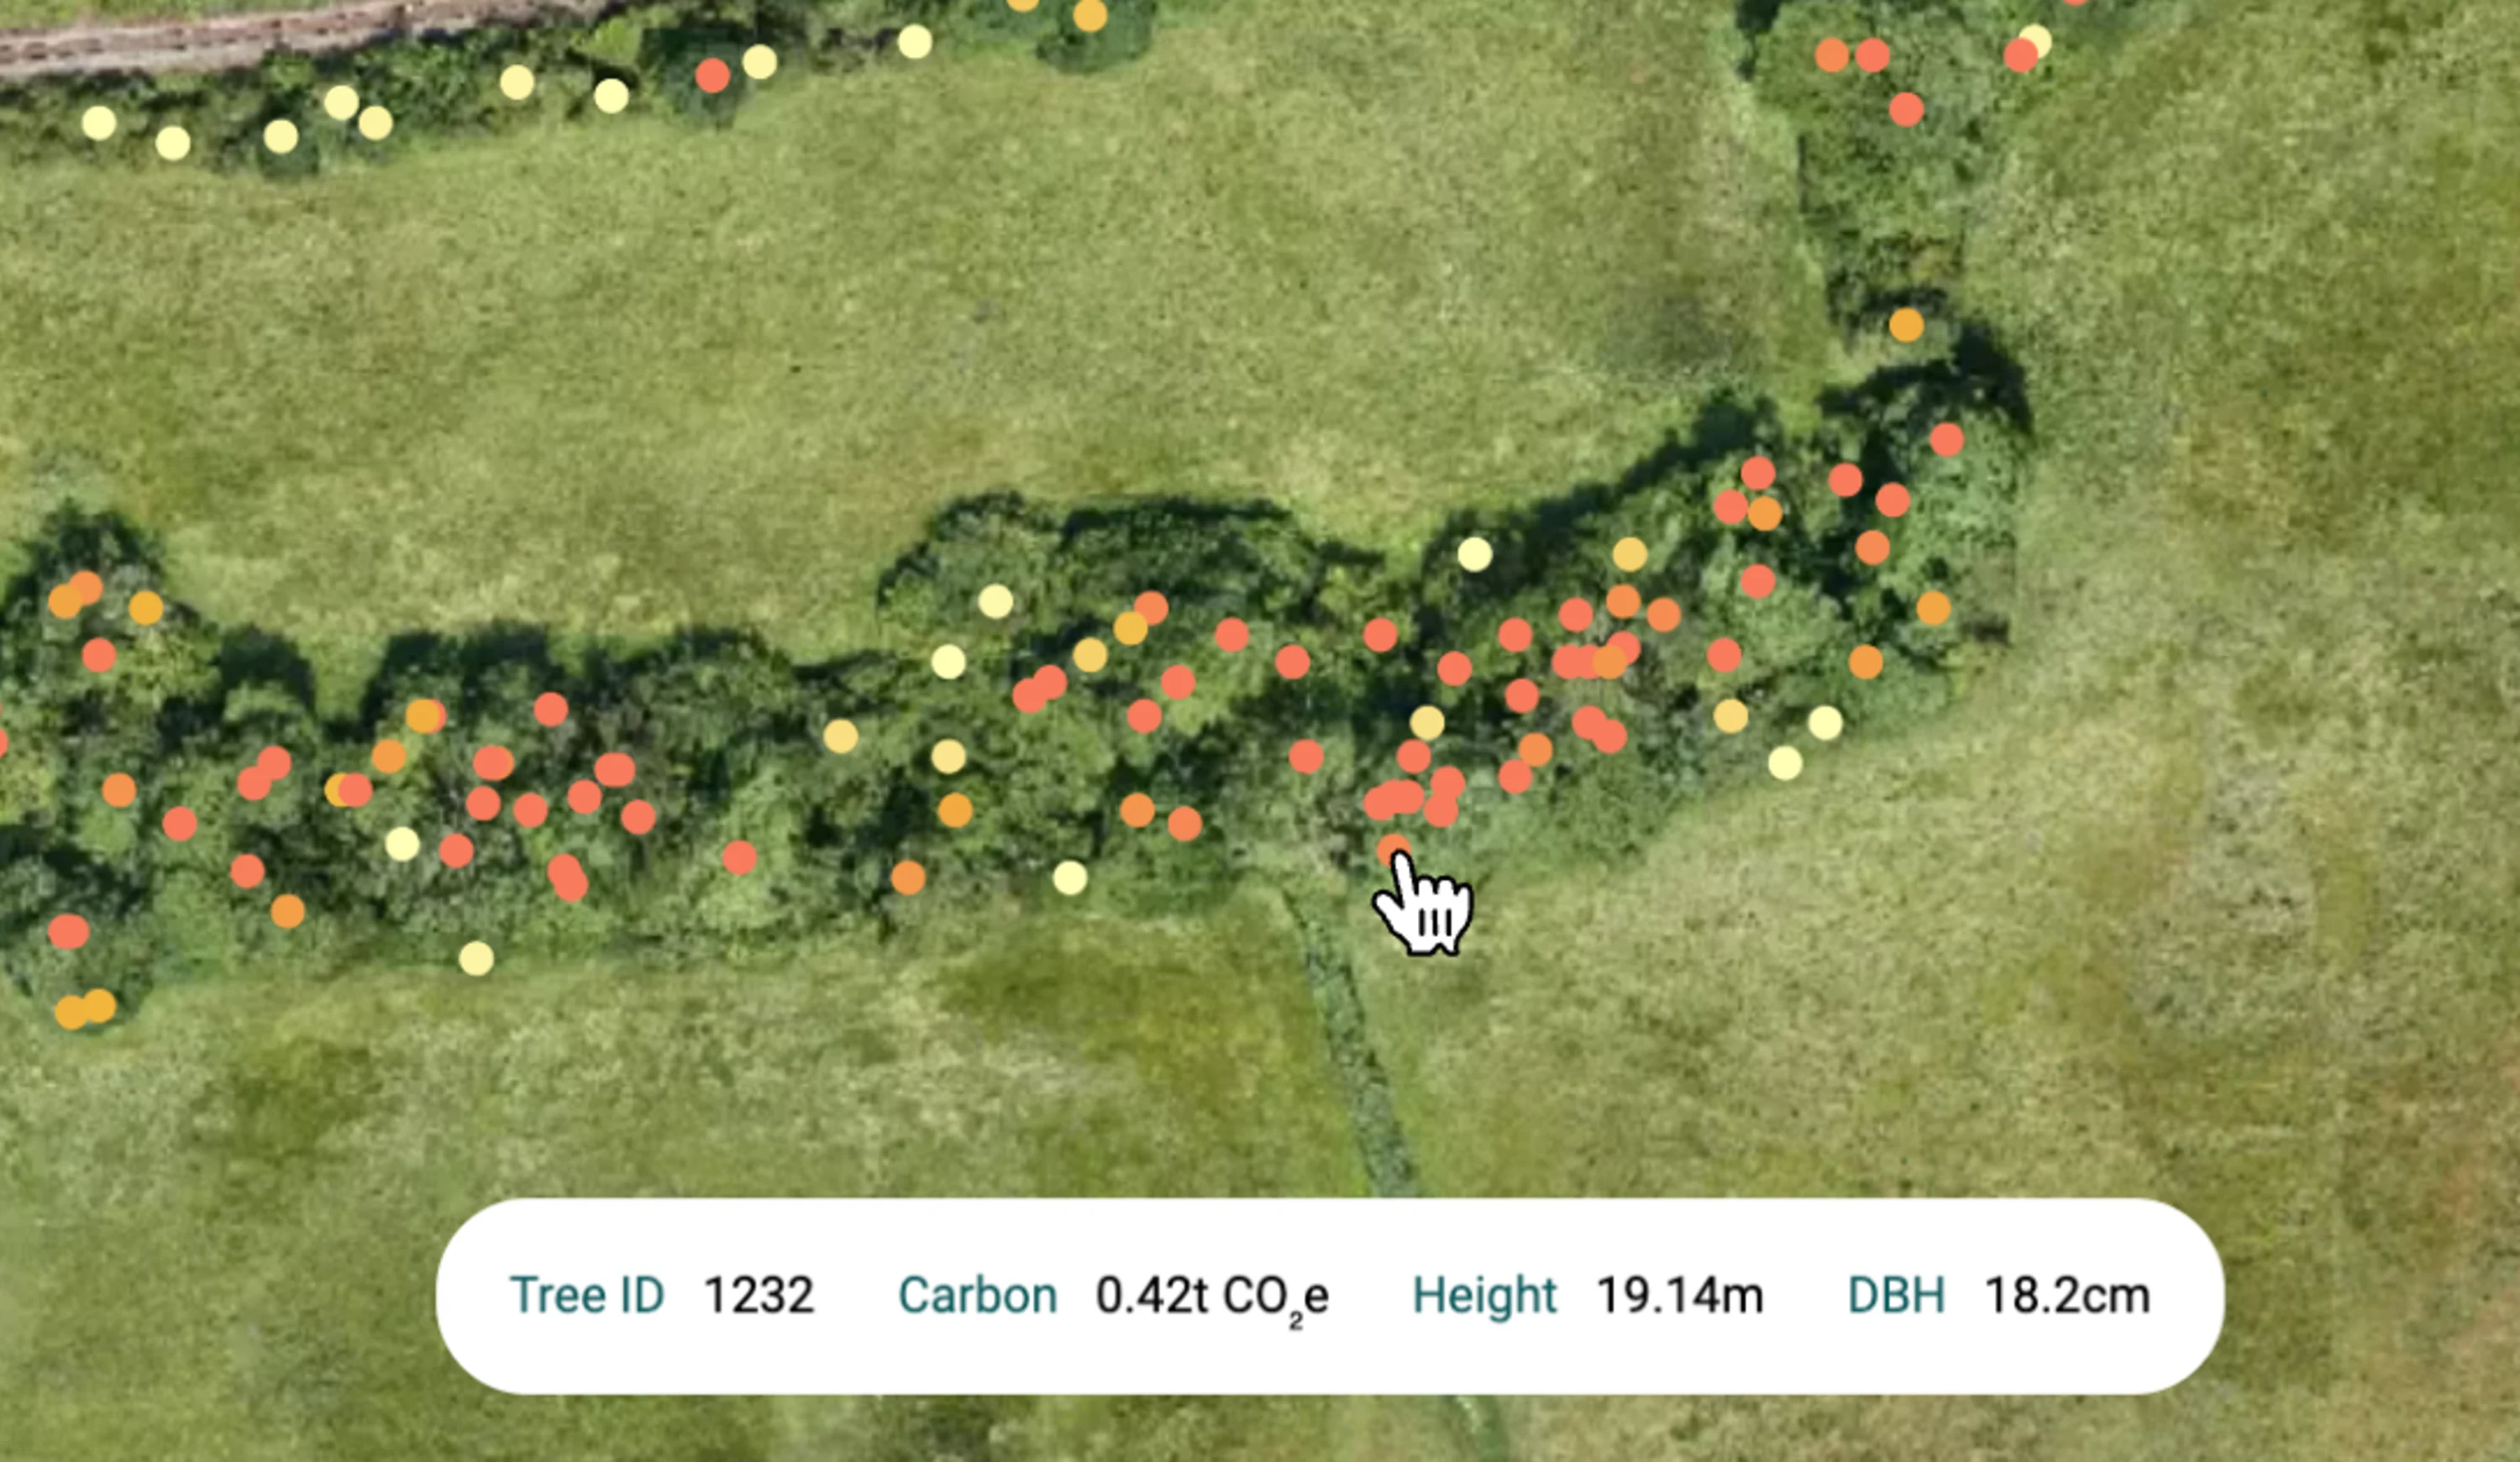
Our computer vision algorithm pinpoints individual tree canopies, allowing tree-level forest insights and carbon traceability, accessible via the Sherwood map explorer view.
Why it matters
Our method provides an unparalleled level of traceability, allowing carbon units to be tracked right back to the individual tree from which they derive. Of course, broader and aggregated insights and metrics can be derived from the count/tree detection layer, offering managers a view of density by compartment and allowing mortality tracking with high spatial accuracy over time.
Our approach was designed specifically for high-value forest carbon removal projects in the Afforestation, Reforestation and Revegetation (ARR) and Improved Forest Management (IFM) categories. Monitoring the establishment and growth of new forests, rather than capturing deforestation events from existing ones, demands a higher level of resolution. We also find that, although coarse earth observation data might suffice for broad oversight of REDD+ forest conservation projects, 10m-30m biomass maps aren’t fit for purpose when it comes to tracking carbon with the precision and accuracy that evolving standards and customers increasingly demand.
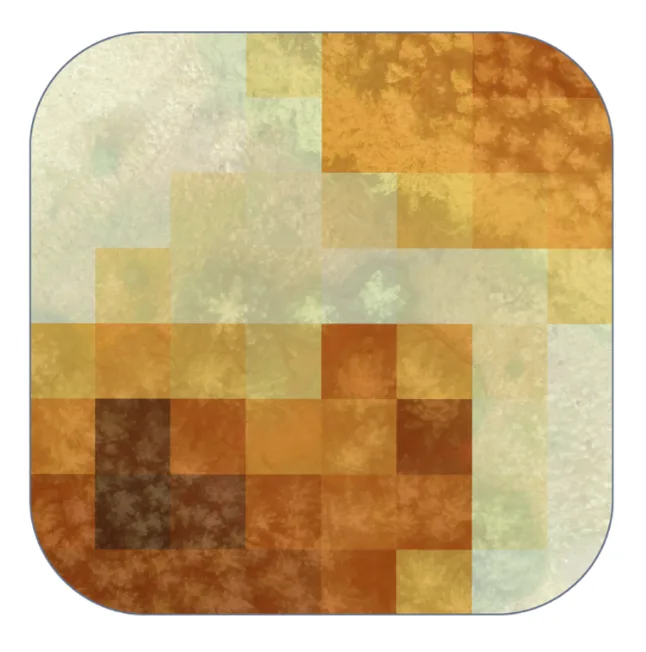
A coarse raster-based carbon map at 10m resolution over a selected forest project area. Darker cells indicate higher biomass and carbon stocks. The map does not conform precisely to forest boundaries visible below and is blind to variation within each 10x10m cell.
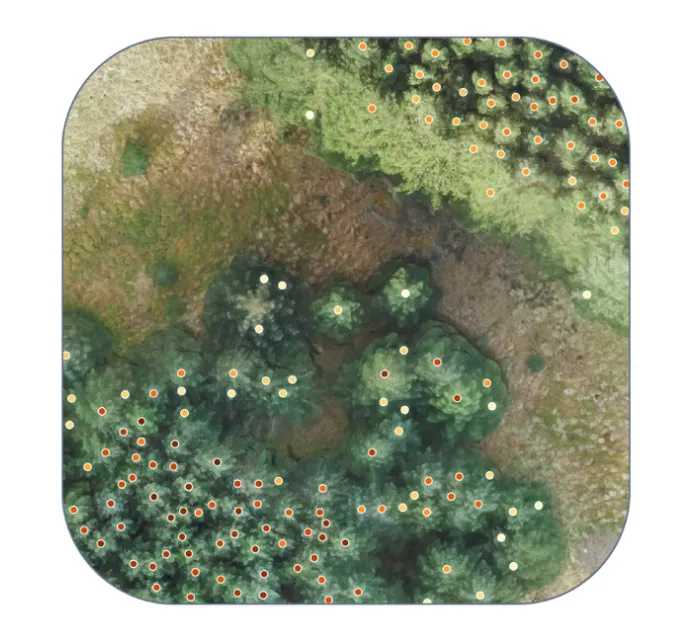
Treeconomy tree counting generates a vector layer over high resolution imagery (<30cm). This approach supports per-tree carbon estimation and a more representative view of true conditions, variability, and ultimately total carbon stocks. Darker points indicate higher tree biomass and carbon stocks.
Treeconomy’s forest carbon assessments can be delivered as a pre-project baseline survey, a one-time stock check, or as part of an ongoing monitoring programme. With tree-level detail, project stakeholders from corporate carbon buyers to project developers can report and disclose confidently and with radical transparency.
Version 2.0 of our Sherwood platform arrives in just a few weeks with a revamped interface and upgraded forest science built in. Sherwood 2.0 makes it easier than ever to request, retrieve, understand, and share forest carbon project assessment results.
If you are a developer, landowner, or investor, seeking more information about Sherwood or Treeconomy’s monitoring services, feel free to get in touch!


