How to Find the Right Restoration Site at Scale
Discover why "eligible" isn't the same as "suitable" and how our two-step, data-driven framework finds the right high-impact restoration projects at scale.
Project Development
Carbon Credits
Science & Tech
Case Study
Nov 12, 2025
Mark Hennen
Many nature restoration projects can be vast and have a complex mix of environmental variables, often requiring extensive field campaigns before development can begin. This combination can be prohibitive for project developers and investors. Proceeding without critical geospatial insights increases the risk of ineffective restoration outcomes, while gathering them traditionally is often too slow and costly.
Earth Observation (EO) data provides consistent and reliable information over vast and often inaccessible ecosystems, enabling far greater efficiency than traditional on-the-ground surveys. Yet, turning EO data into actionable restoration insights requires a two-step strategic process.
Our two-step framework it’s designed to de-risk projects, save critical planning time, focus investment, and even determine whether a project succeeds or fails. It answers two distinct questions: first, the eligibility check (where can we restore?), and second, the suitability index, (where should we restore?)
At Treeconomy, we recently applied this two step framework in partnership with Vlinder on their ambitious Papariko Mangrove Restoration Project aiming to restore over 3,000 hectares of mangroves in Kenya. Leveraging our expertise in EO remote sensing, and geospatial modelling, we supported Vlinder in analysing over 50,000 hectares of Kenyan mangrove.
Step 1: The Eligibility Check - Where Can We Develop?
The first step is critical: identifying areas eligible for restoration under stringent Verified Carbon Standards (VCS), such as Verra. For large-scale projects, like the 50,000-hectare Papariko Project, it would have been challenging to pinpoint areas that show both existing degradation and a history of change compatible with the standards using field surveys alone. Here, Earth Observation (EO) data offers a crucial advantage, enabling frequent, consistent monitoring of entire regions while saving months of fieldwork and significant cost. But while availability of EO data has grown in recent years, the real challenge lies in the complex analysis required to accurately detect degradation.
Degradation Mapping with Machine Learning
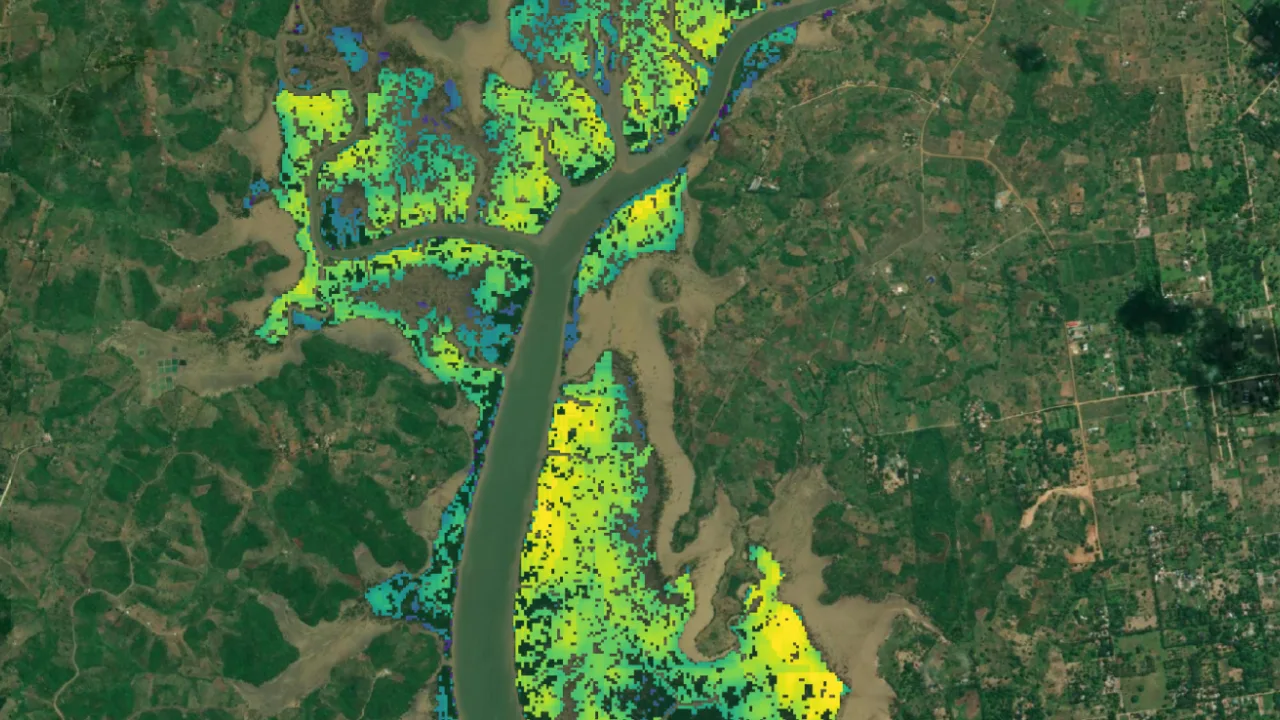
A machine learning model is only as good as the data it is trained on. Collaboration with the project developer is therefore essential. For the Papariko Project, Vlinder provided high-quality ground truth data from multiple field surveys. These data were critical for calibrating our bespoke multi-sensor classification model, allowing us to train and validate it with high confidence. The model ultimately achieved an 86% overall accuracy, with all classifications below 80% rejected to ensure reliability and quality.
Example of Treeconomy KNN mangrove degradation model classification. Degraded areas are scored by classification confidence values, all areas below 0.8 confidence (80%) are masked.
Our Approach
To ensure our model was both accurate and compliant, our approach centred on two key components:
- Data Synergy: We combined optical (Sentinel-2) and Synthetic Aperture Radar (SAR-Sentinel-1) data to capture both reflective and structural characteristics of the landscape. This fusion allowed consistent monitoring even under persistent cloud cover - a critical advantage in tropical regions.
- Additionality Check: In line with VM0033's additionality requirements, we tracked degraded areas using nine years of optical and eleven years of SAR data. Only locations showing persistent degradation and no signs of natural recovery were considered eligible, ensuring that restoration activities are genuinely additional and necessary.
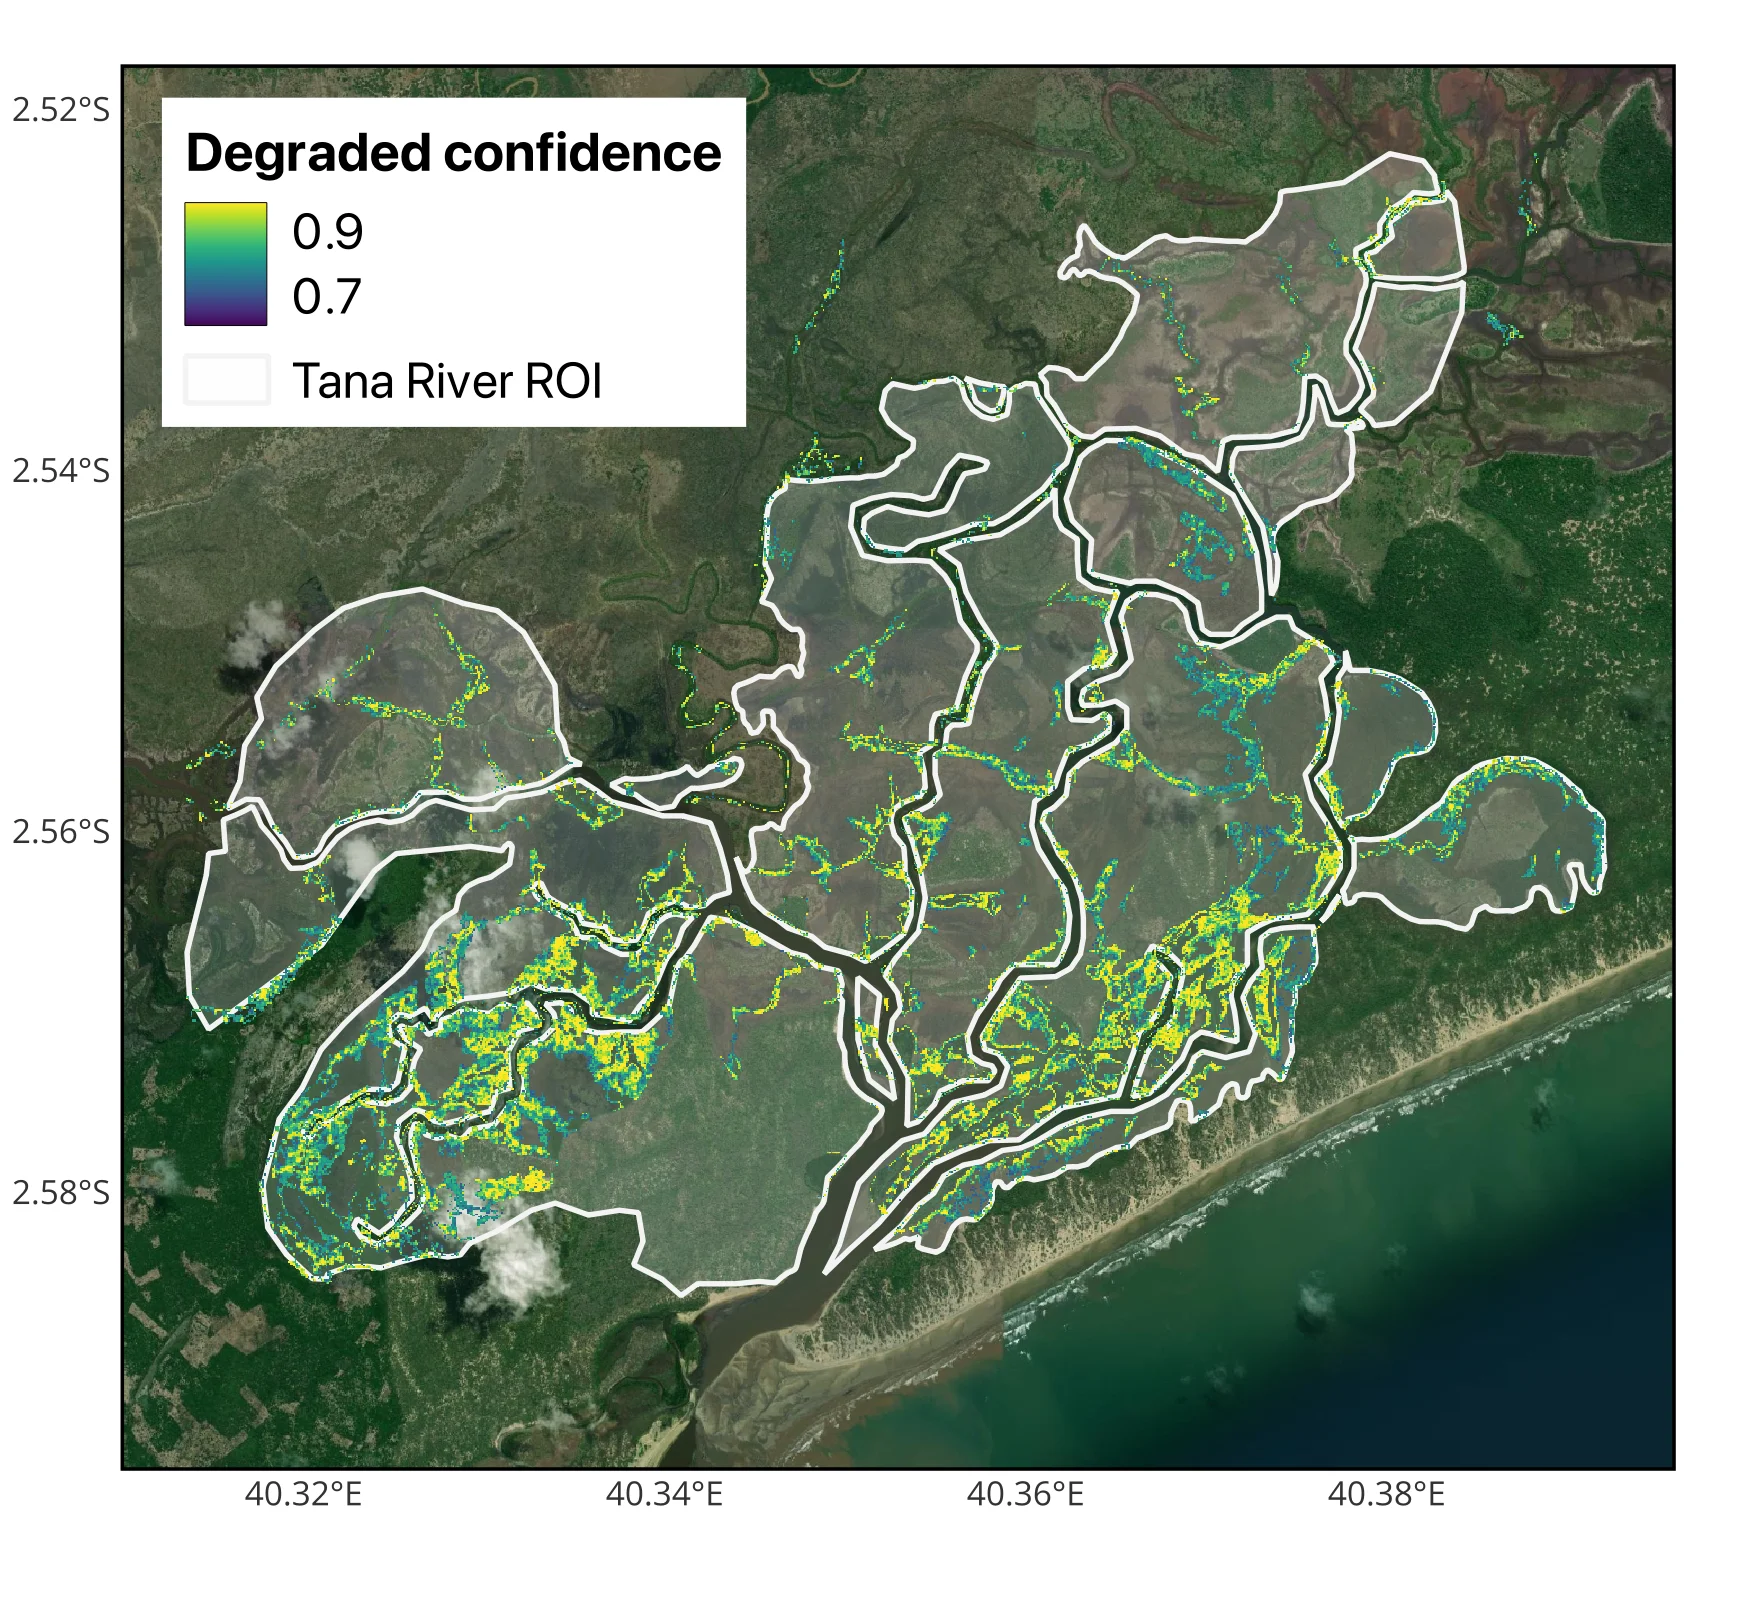
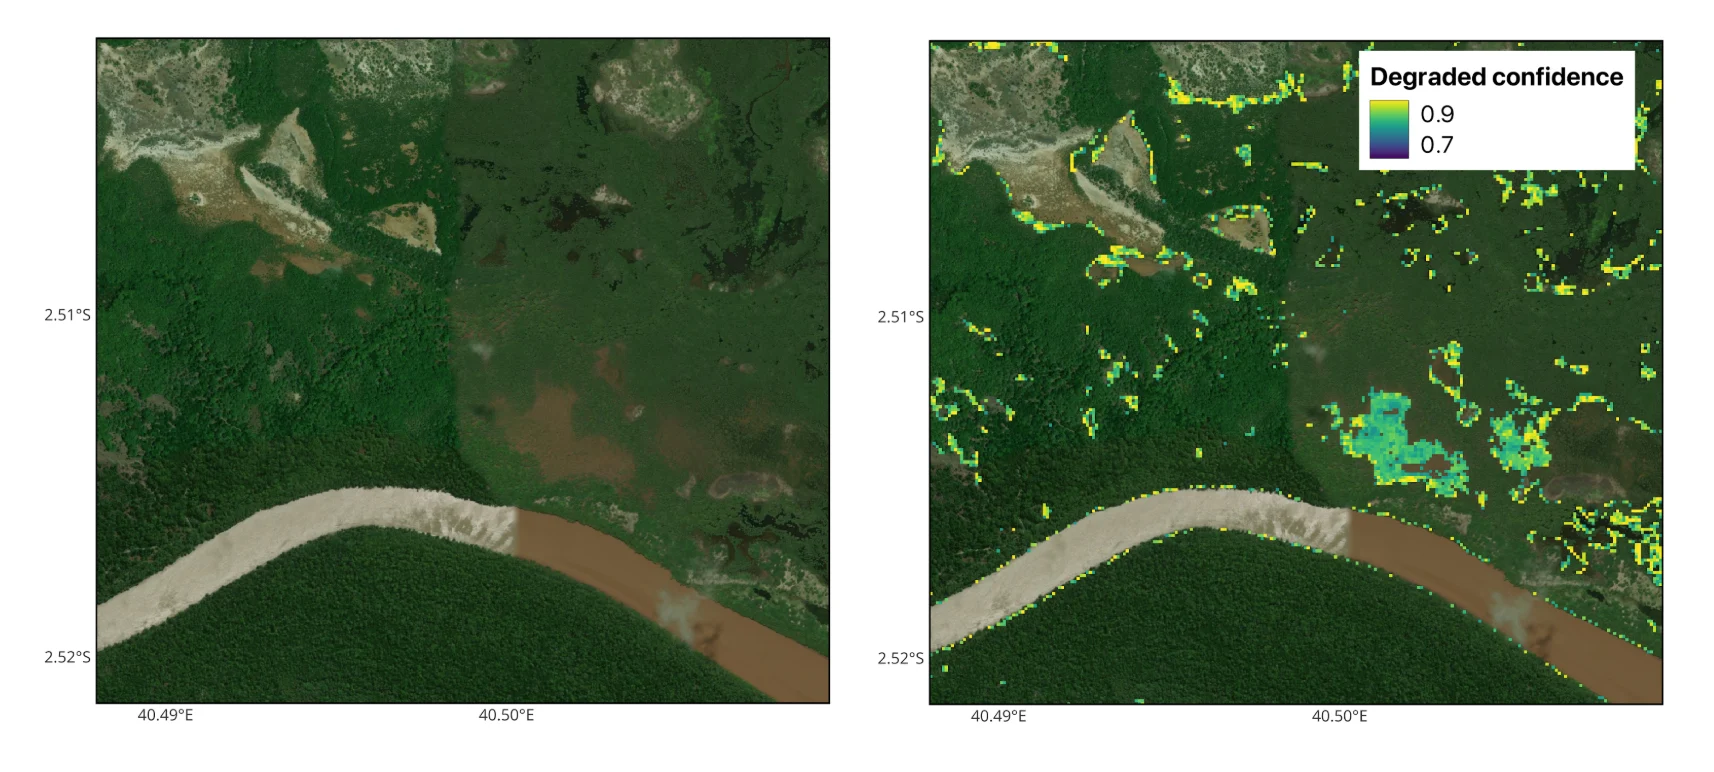
Mangrove restoration eligibility mapping example: Tana River, Kenya. Eligible areas with degraded mangrove classification confidence score >0.8 (80%).
Restoration potential
While the eligibility analysis identifies all possible restoration sites, it doesn’t tell us anything about the relative ecological or logistical benefits at each eligible site.
For instance, in Kenya, our model revealed vast opportunities for mangrove restoration, identifying around 8,583 hectares — roughly 16% of Kenya’s historical maximum mangrove extent (based on Global Mangrove Watch data). At a regional scale, the Lamu District contains by far the greatest total area of eligible mangrove, with 4,019 hectares, or 12% of its 34,000 ha suitable for restoration. Yet, as our further analysis shows, focussing on Lamu may not be the ideal solution.
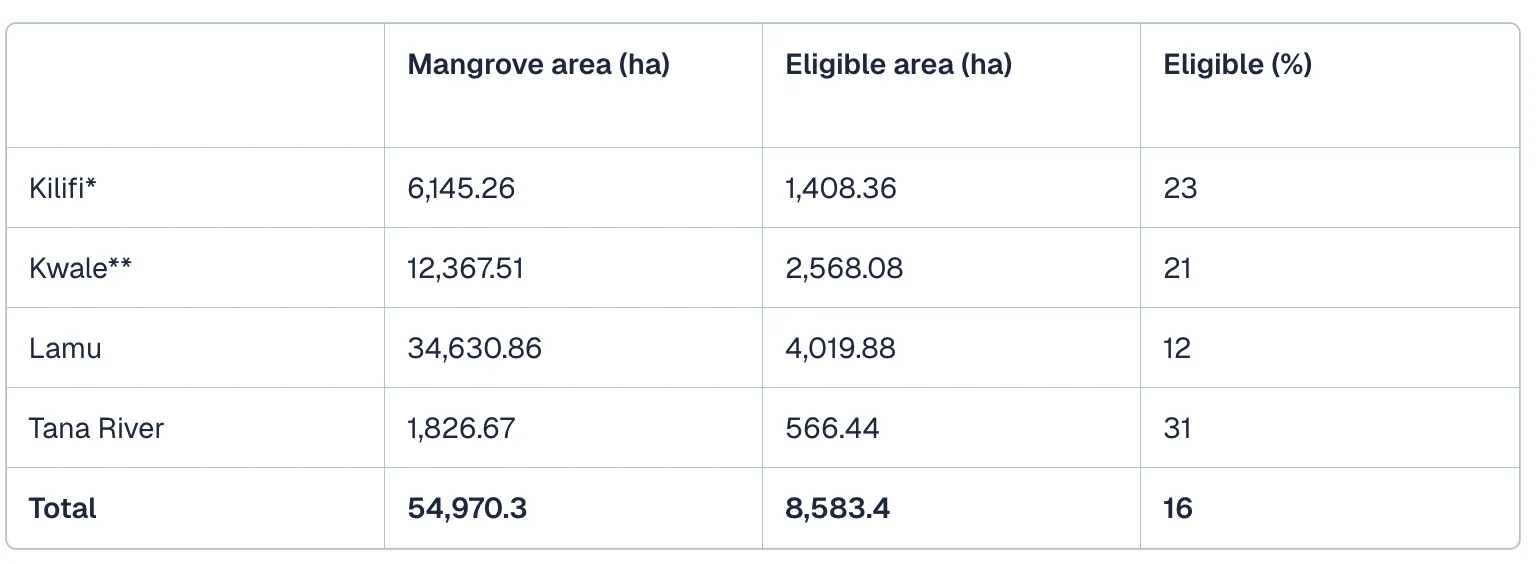
Regional distribution of degraded mangrove eligible for restoration. *Kilifi values include Malindi regions. **Kwale values include Mombasa.
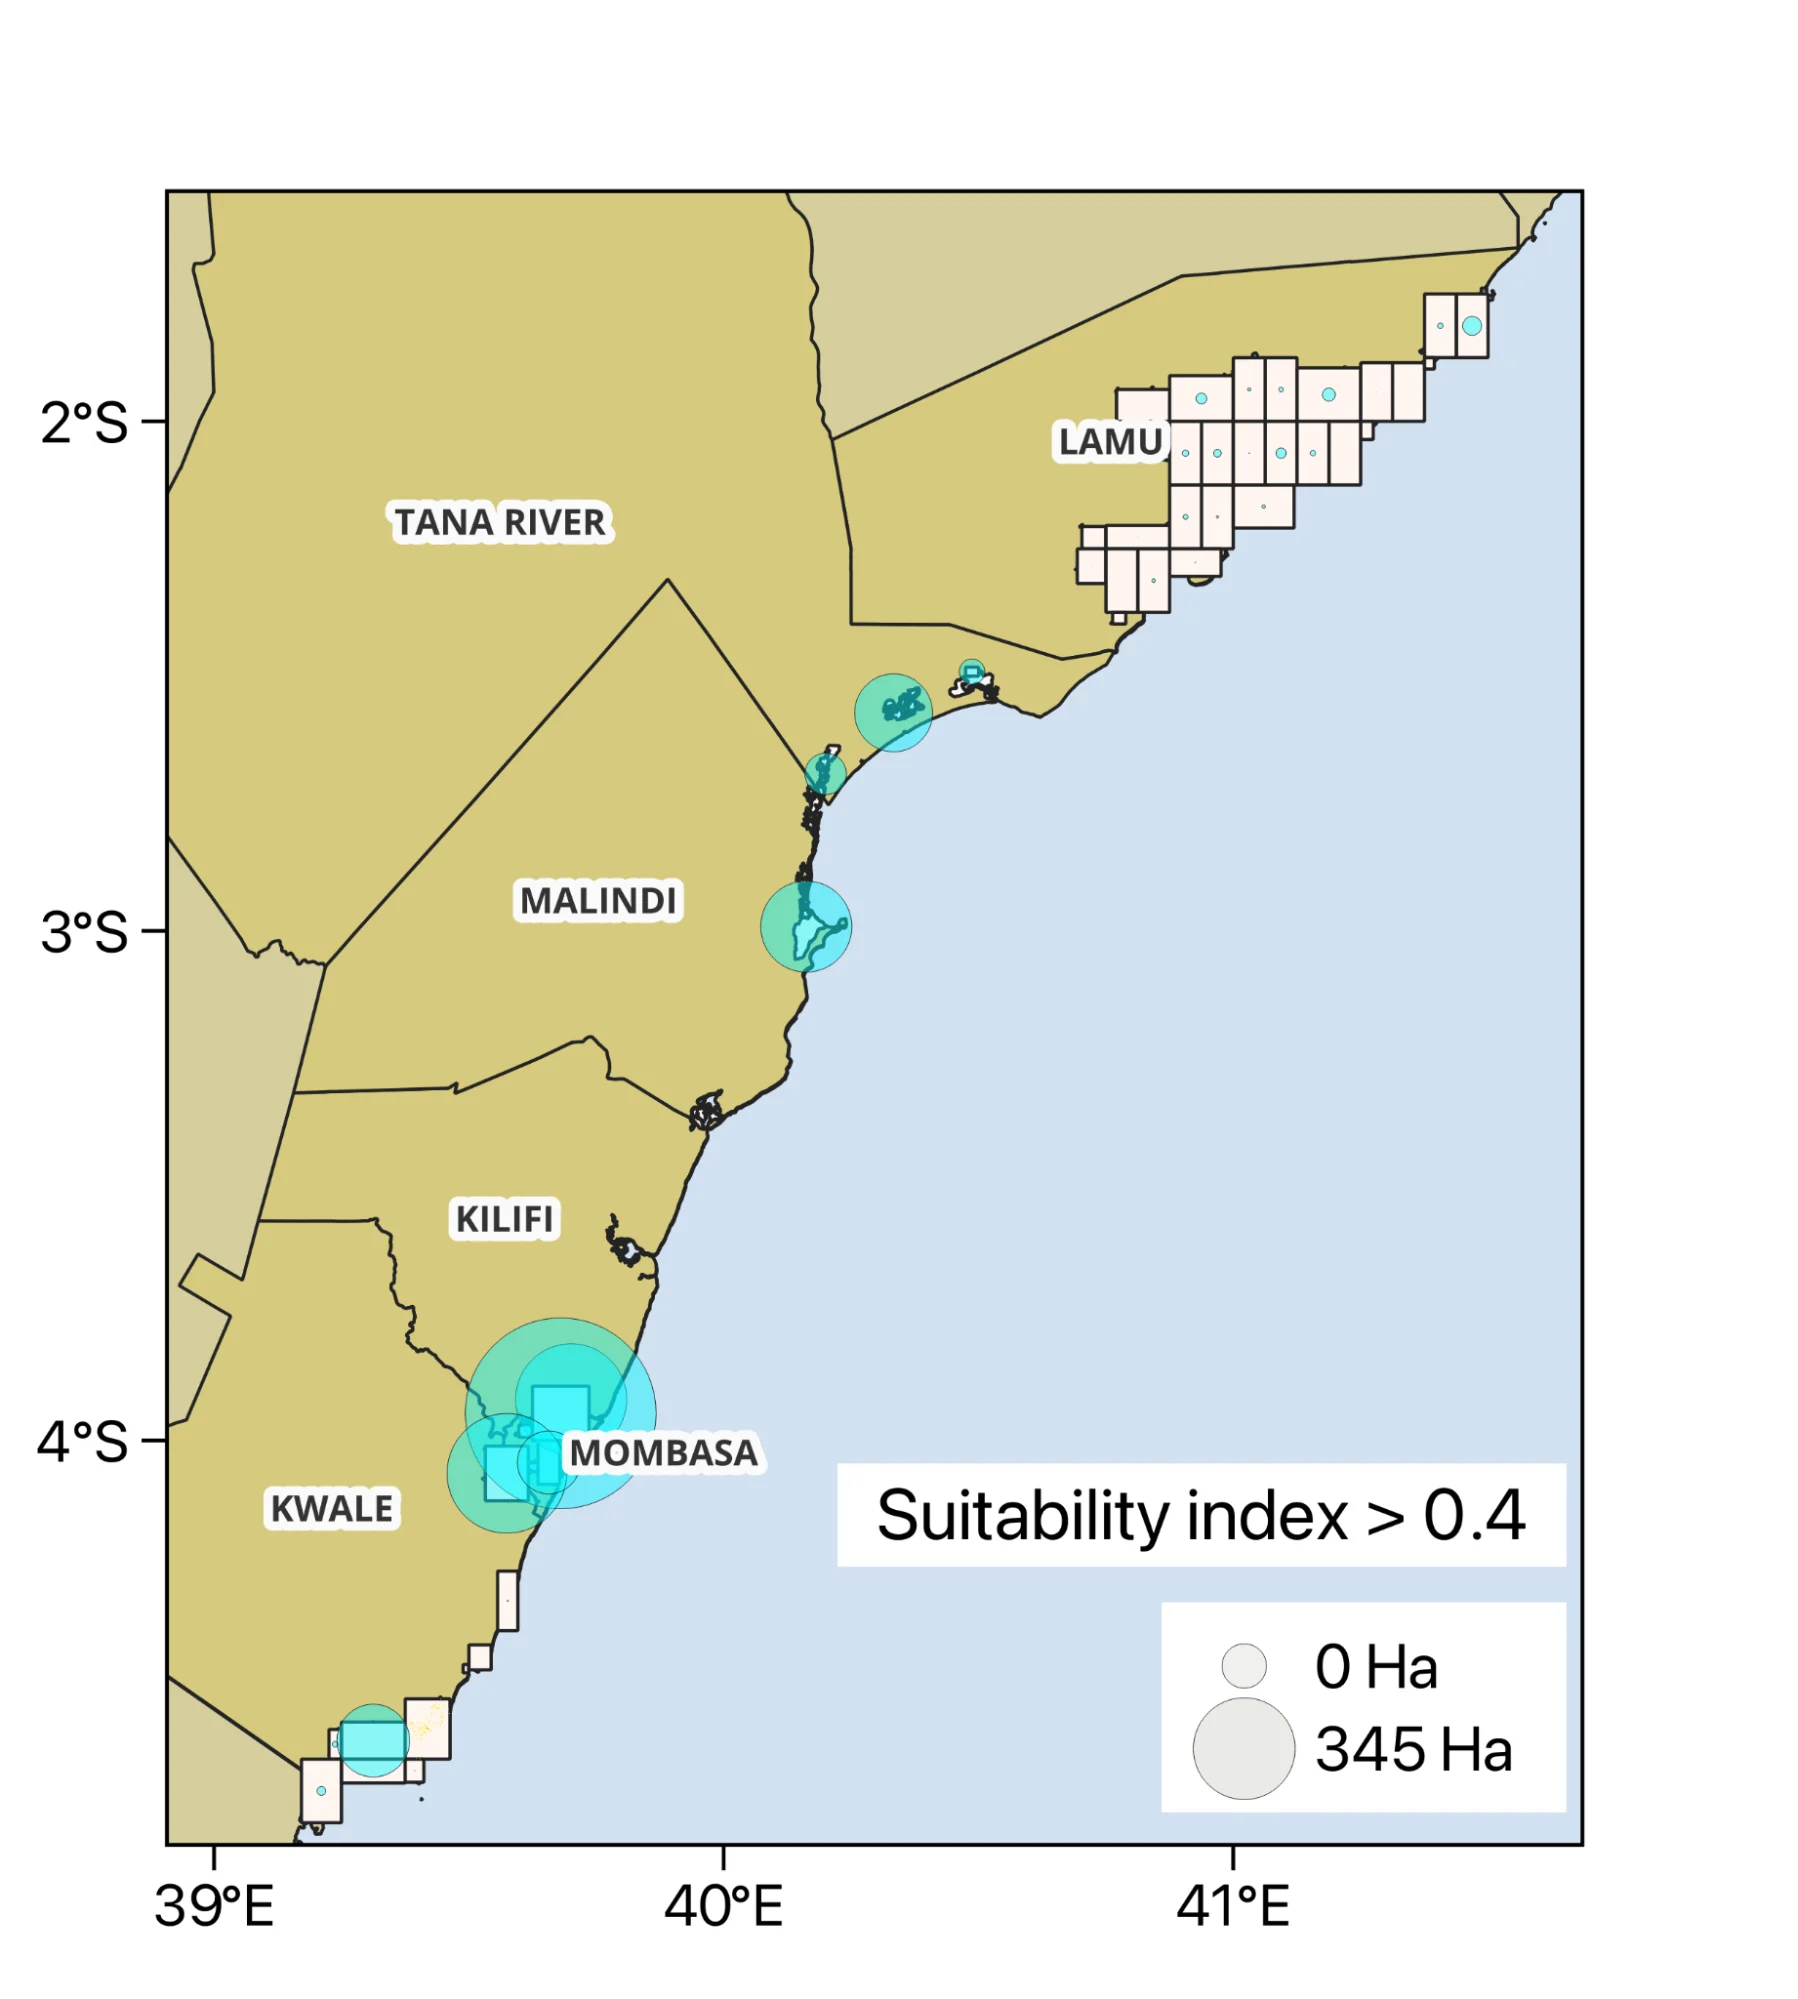
Areas of mangrove which exceed high suitability threshold (0.4) for mangrove restoration in Kenya. Suitability is described for eligible degraded mangrove areas against a project-specific suitability index.
Step 2: Suitability Index - Where Should We Develop?
Intelligent planning: optimising restoration within a geospatial framework.
This is the critical second step. While the Eligibility Check functions as a technical yes/no hurdle, the Suitability Index is a more strategic and flexible tool. It goes beyond legislative requirements to highlight areas where restoration is most likely to succeed — enabling large-scale strategic planning and saving critical time and resources by focusing efforts where they matter most.
Indeed, successful nature restoration is more than just planting trees - it requires careful planning that balances sustainability, community needs, and lasting impact. Therefore, we develop suitability frameworks that combine geospatial data with local ecological expertise to model areas with the greatest potential for successful restoration.
Specifically for the Papariko project, for every area considered eligible under Verra VM0033, we developed a bespoke framework that considers several key parameters when prioritising restoration planning, these included:
- Proximity to open water: ensuring young mangroves have the tidal flow and hydrological connection needed to grow.
- Connectivity: giving preference to larger, continuous patches that are more resilient and support greater biodiversity.
- Clustering/Concentration: focusing on areas with abundant eligible mangrove, where restoration can be scaled efficiently, rather than in isolated fragments.
- Proximity to settlements: recognising that community involvement is vital for sustainable restoration and ongoing stewardship.
- Confidence in degradation: adding emphasis to degraded areas of mangrove with the highest classification confidence scores.
The Insight: The Mtwapa Case Study
When we applied this framework to the Kenyan coastline, we immediately identified around 2,300 hectares as highly suitable for restoration — with just over 1,000 hectares classified as very highly suitable, where restoration is most likely to succeed.
While Lamu had previously attracted higher priority due to its larger extent of eligible area, it actually scored relatively low in suitability, with only 450 hectares (approximately 1.3% of all mangroves) classified as highly suitable for restoration.
In contrast, using the suitability framework reveals the Kwale District, including the Mombasa area, as a standout priority for restoration (Figure 3), with 1,107 hectares — nearly half of all eligible areas — showing high suitability. In Mtwapa Creek, north of Mombasa, the suitability model highlights one of the largest clusters of eligible mangroves (Figure 4). Here, strong tidal connectivity, large contiguous mangrove patches, and close ties to local communities combine to produce some of the highest suitability scores along the coast.
By pinpointing areas like Mtwapa, this approach helps direct restoration efforts where they will have the greatest ecological impact and strongest community support — ensuring lasting benefits for both people and nature.
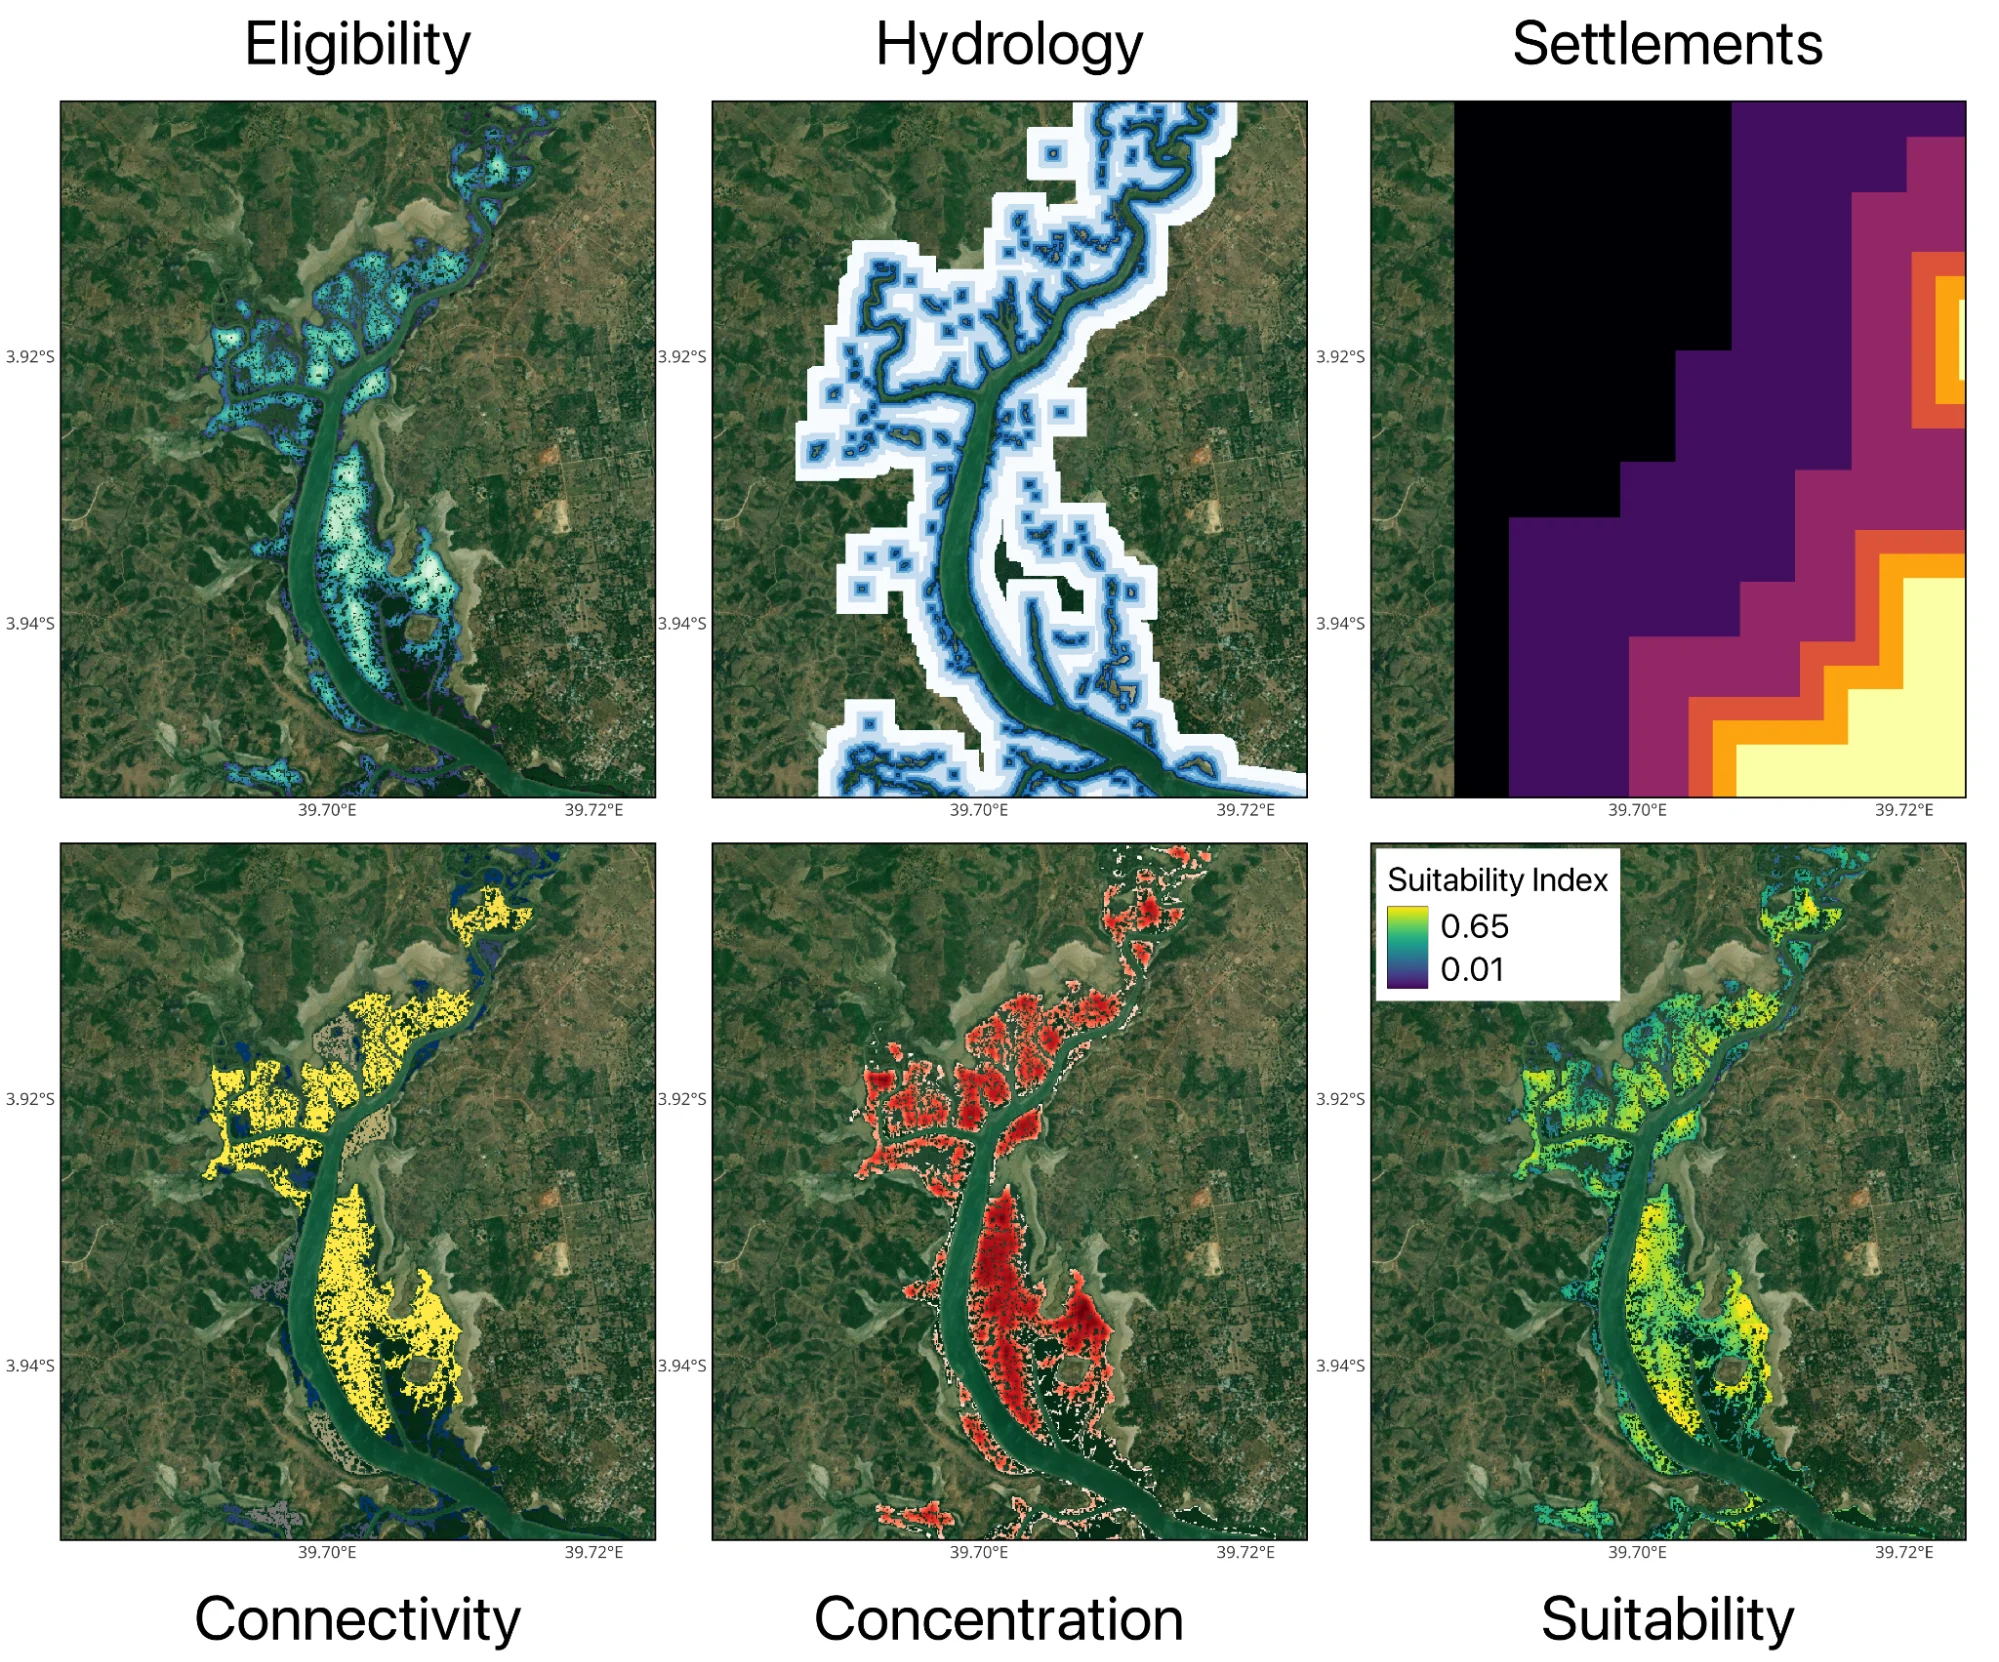
Suitability index parameters mapped over Mtwapa Creek, Kilifi County, Kenya. This area produced high mean suitability > 0.45, due to the high scores in each of the suitability parameters.
Build-a-framework: Designing a spatial tool that suits each project.
One of the greatest strengths of this framework is its flexibility. Each parameter carries a relative weight, shaped by expert judgement and tailored to the specific priorities of each project.
- Want to emphasise ecological resilience? Increase the weight for Open Water and Connectivity.
- Focusing on community engagement? Boost the weight for Settlements.
- If access is your priority, add an infrastructure layer to the framework.
This adaptability makes the model a living tool that can evolve with each new project, ensuring restoration decisions remain both data-driven and context-specific.
From “Where Can We” to “Where Should We”
Ultimately, this two-step process is the difference between finding any land and finding the right land.
The Eligibility Check tells you where you can plant. The Suitability Index tells you where you’ll be most successful.
This is how we move from a simple map to a true restoration blueprint, providing the data-driven confidence needed to build high-impact, high-integrity projects faster and more cost-effectively.
Ready to Design Your Restoration Strategy?
What are your project's top priorities? Contact us to design a suitability framework for any forest restoration project, where we can design a bespoke decision support tool that can help plan where to prioritise your next project.
References
- Mumby P J et al. 2004 Mangroves enhance the biomass of coral reef fish communities in the Caribbean Nature 427 533–6
- Barbier E B, Hacker S D, Kennedy C, Koch E W, Stier A C and Silliman B R 2011 The value of estuarine and coastal ecosystem services Ecol. Monogr. 81 169–93
- Hutchison J, Manica A, Swetnam R, Balmford A and Spalding M 2014 Predicting global patterns in mangrove forest biomass Conserv. Lett. 7 233–40
- Giri C, Ochieng E, Tieszen L L, Zhu Z, Singh A, Loveland T, Masek J and Duke N 2011 Status and distribution of mangrove forests of the world using earth observation satellite data Glob. Ecol. Biogeogr. 20 154–9
- Kirui, K. B., Kairo, J. G., Bosire, J., Viergever, K. M., Rudra, S., Huxham, M., et al. (2013). Mapping of mangrove forest land cover change along the Kenya coastline using Landsat imagery. Ocean Coast. Manag. 83, 19–24. https://doi.org/10.1016/j.ocecoaman.2011.12.004
- Heck, N., Goldberg, L., Andradi‐Brown, D., Campbell, A., Narayan, S., Ahmadia, G., … & Lagomasino, D. (2024). Global drivers of mangrove loss in protected areas. Conservation Biology, 38(6). https://doi.org/10.1111/cobi.14293
- Global Mangrove Watch: https://www.globalmangrovewatch.org/